DSP, AMC & Meta
AMC frequency analysis
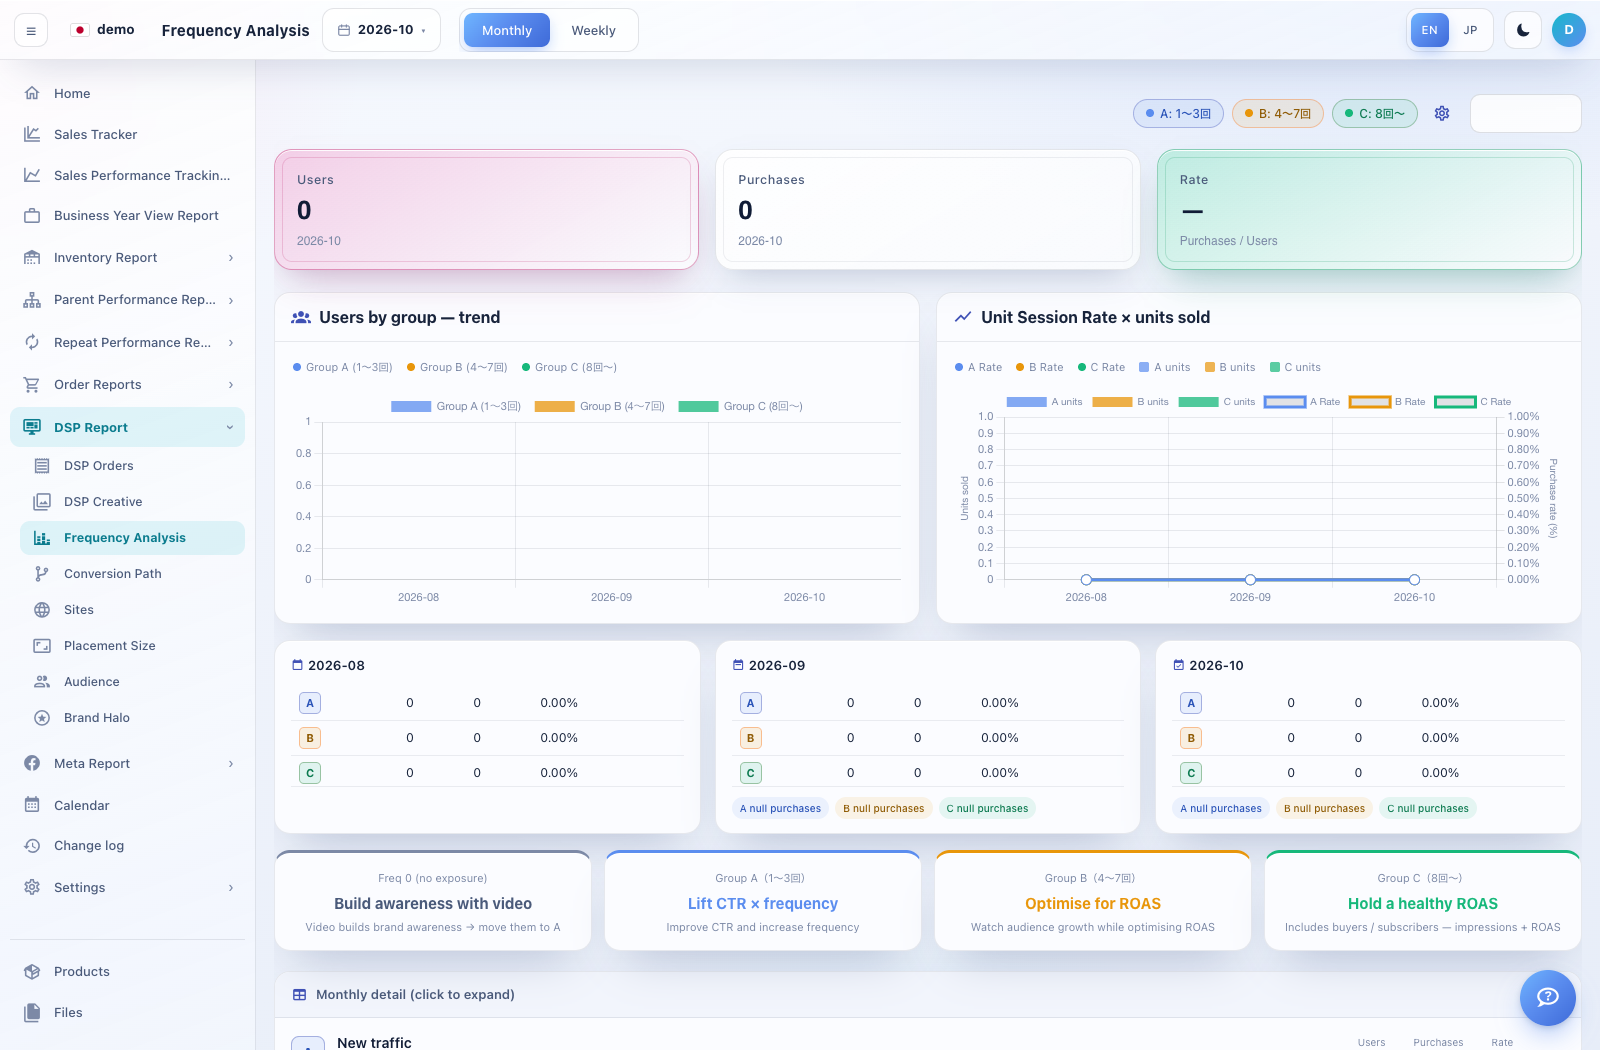
Frequency Analysis compares audience groups by the number of ad exposures and their purchase outcomes.
How to use this page
Open DSP Report → Frequency Analysis. Select Monthly or Weekly and the period.
Read the group definitions above the chart. The demo shows A: 1–3 exposures, B: 4–7 and C: 8 or more; account settings can change the ranges.
Compare users, purchases and purchase rate across groups. Review the trend and expand the detail section if available.
Use this to explore frequency and outcomes together. A high-exposure group may also contain existing buyers, so a difference between groups does not establish a causal lift.