Sales & performance
Business Year View: understand sales and traffic
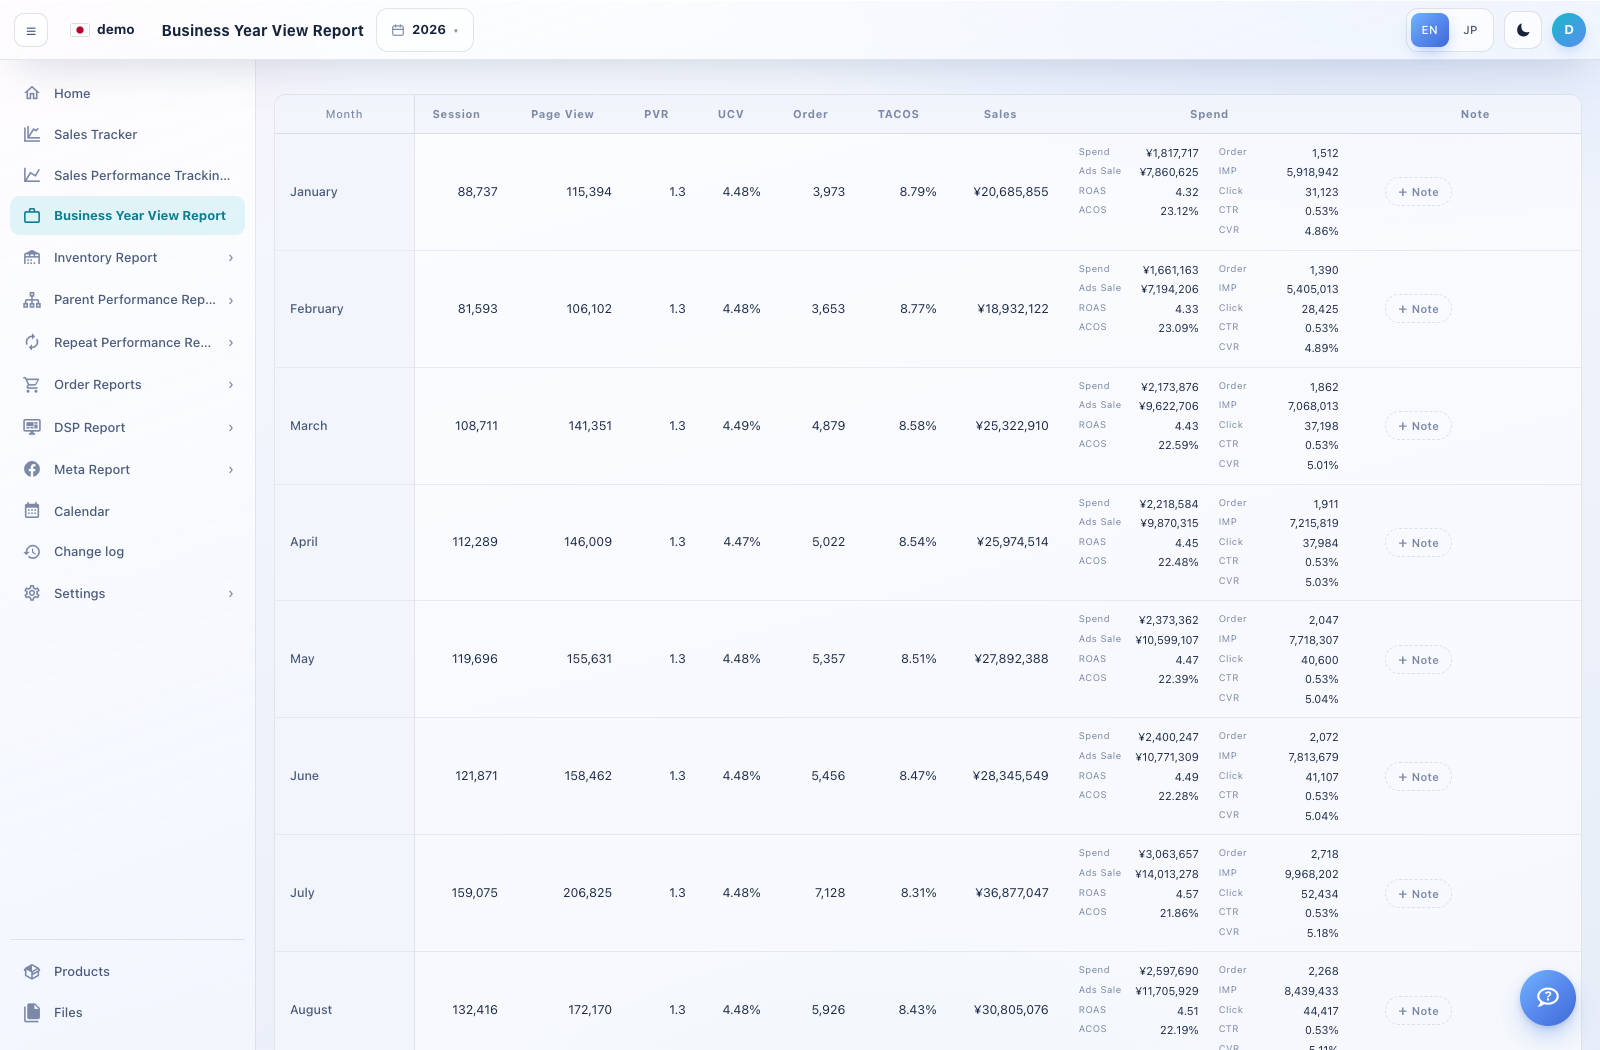
This report places business metrics and advertising summaries alongside each month of a selected year.
How to use this page
Open Business Year View Report and select the year in the top date control.
Compare Session, Page View, PVR, UCV, Order, Sales and TACOS across months. Expand metric details using the controls beside supported headings.
Inspect the Spend column for its advertising summary: spend, advertising sales, ROAS, ACOS, orders, impressions, clicks, CTR and CVR.
Use + Note beside a month to record context such as a sale event, stock interruption or pricing change. Review the period and save the note when you intend to record it.